Daily Enrollments Block
This Gutenberg block lists the User enrollments in the courses with respect to the dates, It lists the total number of enrollments in the selected timeframe along with the line chart of the daily enrollments.
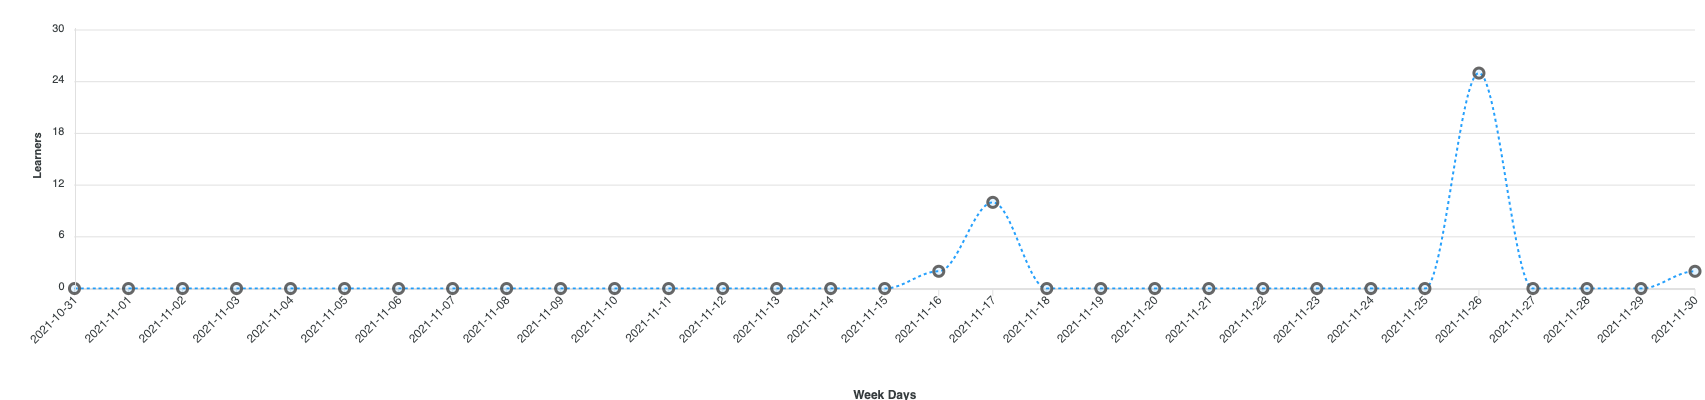
- The graph for the total number of daily learner enrollments for the selected date range.
- The Insight – ‘Average Daily Enrolments’ is the Total enrollments in all courses divided by the number of days in the selected date range.
- For example – Total enrollments between 10th-14th November is 20 so the Avg is 4.
- Benefits: To check enrolment trends for different time frames.
- You can export this graph as SVG or PNG & can export the graph data as a CSV file from the top-right menus.